Serviced Office Pricing Insights: UK & London Annual Review
This annual review examines how serviced office pricing across London and the UK changed between January 2025 to January 2026. The report focuses on serviced offices, highlighting how pricing varied across different locations over the course of the year, using data from the FreeOfficeFinder pricing tool.
The review also explores the factors behind these changes and what it means for businesses seeking office space for rent in 2026.
Market Overview: How Serviced Office Pricing Behaved in 2025
We observed that serviced office pricing across the UK remained largely stable during 2025. The national average increased slightly from £312 per desk per month to £316, indicating steady demand for serviced office space outside the capital.
In contrast, pricing in London eased over the year. The average rate of a serviced office in Central London fell from £649 to £626, while Greater London saw a reduction from £337 to £326. This shift reflected a gradual pricing adjustment, rather than a drop in demand, as the market stabilised following several years of disruption.
The pricing patterns captured through our pricing tool mirrored wider market trends, with costs increasingly shaped by location quality, transport connectivity, and the types of occupiers each area attracts. Regional markets showed resilience, and while London remained the most expensive market, pricing entering January 2026 was less inflated than at the start of 2025.
London Comparison: Central vs Greater London
We found that both Central and Greater London recorded similar declines over the year. Our pricing tool demonstrates that Central London prices fell by approximately 3.5% and Greater London by 3.3%. Despite similar outcomes, the underlying factors behind this are significantly different.
In Central London, pricing softened as occupiers became more selective, prioritising high-quality office buildings in key locations. As a result, providers of less competitive stock were forced to lower rates to remain attractive. As outlined in our recent 2026 report, we expect this pressure to continue throughout 2026. In Greater London, the shift was largely shaped by cost efficiency and transport access.
Central London
The West End
Data from our pricing tool indicates that the West End remains the most expensive serviced office sub-market in 2025, although pricing varied depending on the location.
At the top end of the market, office space for rent in Mayfair strengthened from £942 in January 2025 to £965 at the start of 2026. This reflects a continued demand for premium serviced workspace. Elsewhere, pricing generally eased. Soho declined from £940 to £888 while Piccadilly experienced a sharper adjustment, falling from £747 to £625.
Overall, the West End demonstrated a clear move to quality, with areas offering high-spec buildings, strong amenities and an established reputation proving far more resilient than secondary options. By January 2026, pricing across the West End remained elevated but was more closely aligned with occupier expectations than at the beginning of 2025.
The City of London
Pricing within the City of London was broadly stable throughout 2025. Our data shows that Moorgate softened from £633 to £597, while Cannon Street remained relatively consistent, recording averages of £690 in January 2025 and £670 at the start of 2026.
In Bank, the cost of a serviced office was around £736 in January 2025. However, our pricing tool showed a sharp peak of £824 in July 2025, before rates settled back to £737 by January 2026. This mid-year spike reflects a short-term demand surge rather than a sustained change, suggesting that pricing can be cyclical, rather than linear.

City Fringe & Key Business Hubs
Several City Fringe locations and major business hubs provided some of the clearest examples of the market rebalancing during 2025.
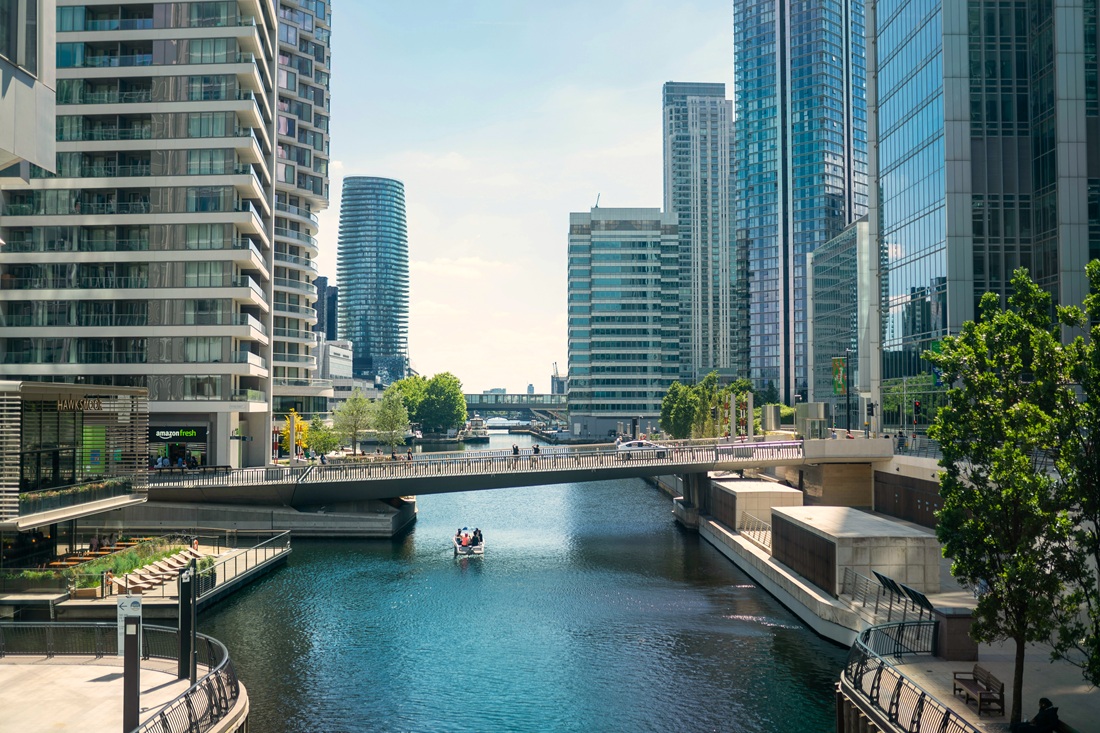
Our data shows that Canary Wharf strengthened from £490 to £551, supported by its modern office stock and excellent transport links. A similar pattern was also evident in other well-connected fringe locations. For example, King’s Cross saw a modest decrease from £705 to £679, while Paddington remained stable with average rates of £570 in January 2025 and £561 in early 2026.
On the other hand, we recorded a decline from £552 to £491 for serviced offices in Old Street, highlighting the growing pressure on smaller tech clusters as demand eased and companies became more selective in their office space rentals.
Although also a popular location for tech-based businesses, Shoreditch proved more resilient, softening from £585 to £566. This reflects the area's broader occupier mix and availability of design-led serviced offices.
Southbank & South Central
Pricing across Southbank and South Central London eased overall, but performance varied by location.
Our pricing tool shows that rates for office space in Victoria were around £847 in January 2025. Pricing reached a high of £894 in October 2025 before falling to £820 by January 2026. Waterloo decreased from £532 to £447, while Southwark declined from £705 to £643.
In contrast, we recorded a modest increase from £706 to £719 in London Bridge, underpinned by its convenient transport access and sustained occupier interest. Vauxhall showed a similar upward trend, with prices rising from £448 to £455, supported by improved infrastructure and a greater supply of high-quality, Grade A workspaces in the area.
Greater London
West and Northwest Greater London
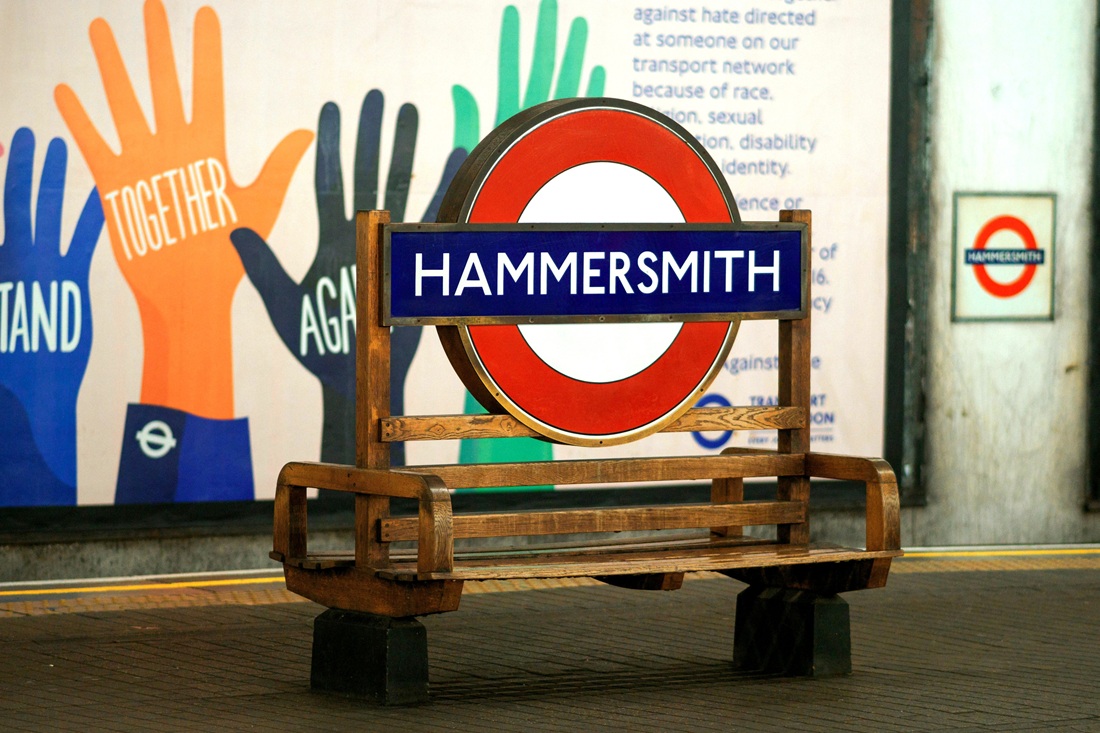
Locations in the West and Northwest of Greater London were relatively stable throughout 2025. Data from our pricing tool shows that Hammersmith rates rose from £461 to £471 and Uxbridge saw a slight increase from £308 to £310. However, the average cost of serviced office space in Ealing declined from £382 to £340 due to a drop in demand.
North Greater London
Northern parts of London displayed a clear split. Pricing in Islington rose from £383 to £409, reflecting costs more aligned with Central London. Camden remained flat, while Finchley fell from £301 to £279, indicating greater price sensitivity in locations further from the City centre.
South & Southwest Greater London
In the South and South Western part of London, rates in Chelsea were broadly unchanged (£441 to £442). However, our data shows a decrease for Fulham from £425 to £365 and from £346 to £296 in Clapham, as companies increasingly chose alternative locations offering lower costs.
In comparison, we observed a price increase in Richmond, rising from £334 to £353, which is likely due to the limited supply of serviced office space rather than increased demand.
East & Southeast Greater London
In the East and Southeast of Greater London, our data shows a sharper decrease from £299 to £239 in Croydon, establishing the lower end of the pricing range in this part of London. This reflects its position as a price-led market, where companies have a broader choice of lower-cost options, resulting in greater downward pressure.
Stratford’s role as a key transport hub helped prices remain stable at £294, while rates in Hackney softened from £351 to £355 due to its diverse range of businesses.
United Kingdom
Major Regional Cities
Outside of London, performance across the UK’s other major regional cities was mixed over the course of the year.
We recorded a strong uplift in Bristol, where serviced office rates rose from £302 to £372. Birmingham also saw modest growth from £339 to £359 at the start of 2026.

Manchester remained one of the UK’s key office markets during 2025, shaped by continued growth across the tech, digital, and media sectors. However, our pricing tool data shows that rates declined from £348 to £301, showing that increased supply and cost-conscious behaviour limited rate increases despite strong enquiry levels throughout the year.
Leeds remained relatively stable overall, reflecting its role as a strengthening business hub, particularly for companies seeking smaller, more flexible office space.
Scotland & Wales
Serviced office markets across Scotland and Wales showed relatively limited movement and greater stability. This is reflected in our data, which shows that Aberdeen remained flat at £251 in January 2025 and £252 in January 2026. Rates in Cardiff lowered slightly from £207 to £202, and from £302 to £270 in Glasgow.
Compared with England’s major cities, these locations experienced fewer price shocks and greater predictability.
Southeast & Knowledge-Led Markets
The Southeast and knowledge-led markets experience some of the most notable pricing growth in 2025. Cambridge strengthened from £580 to £606, bringing average rates closer to those seen in Central London. Reading rose from £296 to £333, Brighton from £308 to £351, and Milton Keynes increased from £268 to £311.
These locations benefited from a combination of proximity to London, strong sector focus, and convenient transport links. Demand remained consistent, gradually narrowing the pricing gap with London.
London vs the Rest of the UK
By January 2026, London pricing still sat at roughly twice the UK average, though this disparity had reduced at the upper end of the regional market. Several regional locations outperformed individual London sub-markets, reinforcing the importance of considering serviced offices across the UK, rather than solely focusing on the capital.
What This Means for Businesses in 2026
For companies looking to rent office space in 2026, the key takeaway is that prices are stabilising, rather than rising quickly. Budget certainty has improved, with location decisions now being increasingly shaped by value, connectivity and suitability, rather than prestige alone.
2025 marked a reset in serviced office pricing, rather than a period of rapid growth or decline. At the start of 2026, rates are more predictable, making it easier for companies to make clearer, more confident decisions when renting office space.
This is reflected in the trends captured by our pricing tool, which show that pricing across the UK has stabilised following several years of disruption.